
BES Food Washing Ozone Simulation Report
Recirculating Food Washing SystemConveyor spray + tank return • Pump / glass filter / external ozone loop • continuous makeup/drain
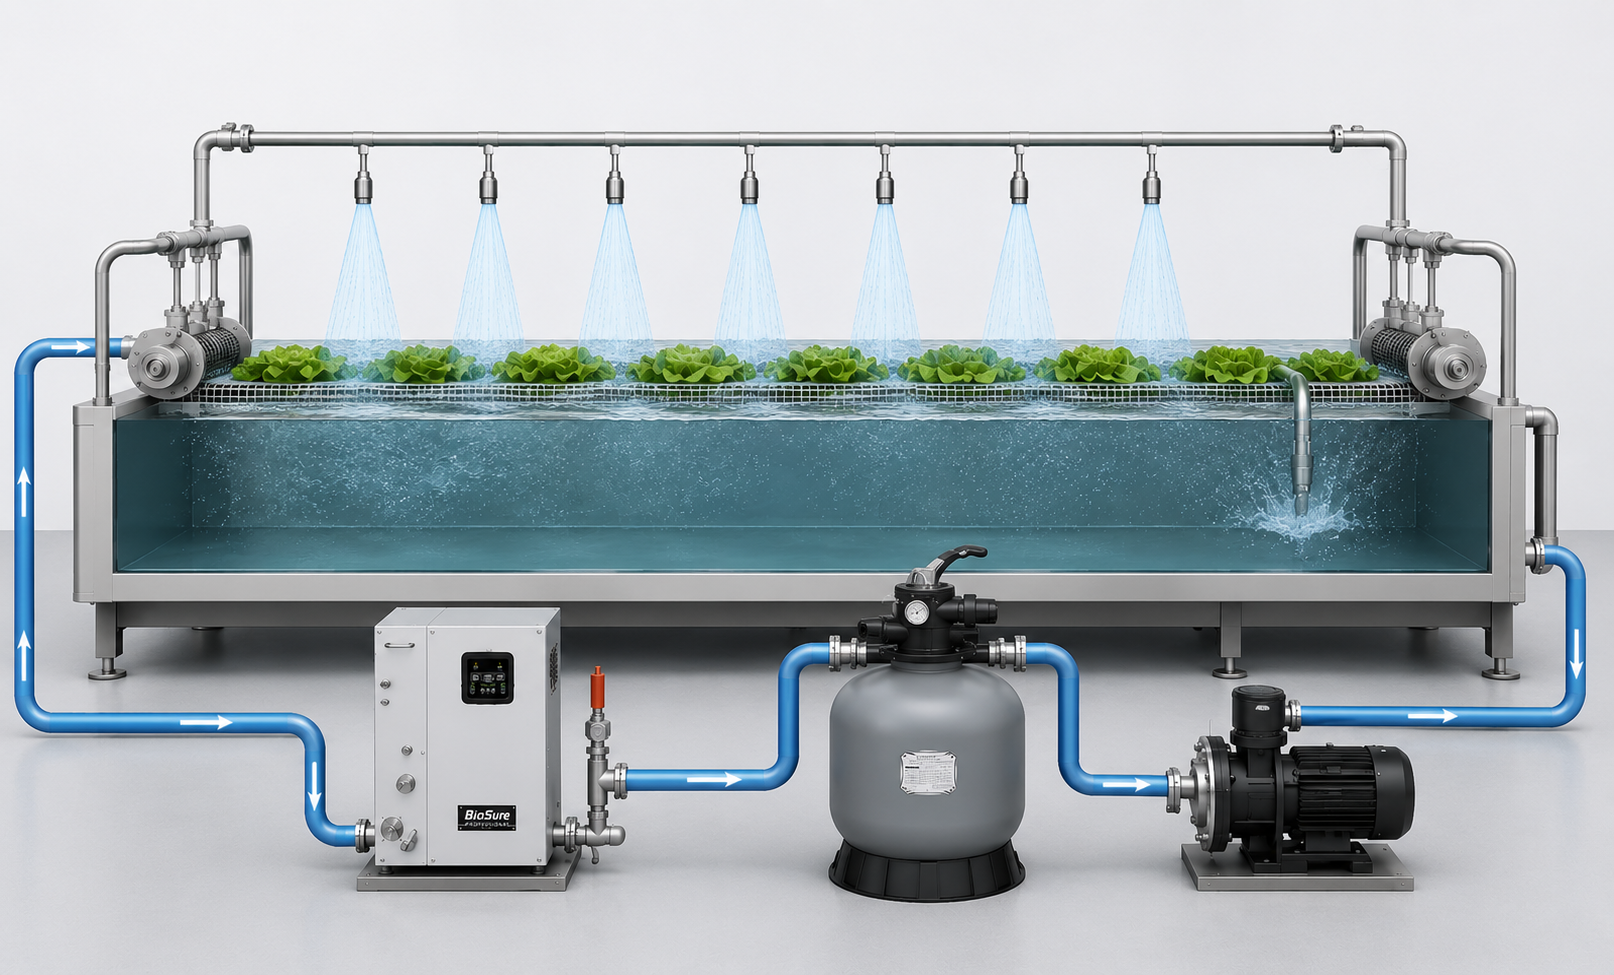
Makeup50 LPH
Drain out50 LPH
Water use400 L/day
Top spray 120 LPHTank return 80 LPH
PERFORMANCE SUMMARY
Selected ProductOWS-1 × 1
End-wash Residual0.261 mg/LFAIL · target 1.000 mg/L
Daily CT0.24 mg·min/LFAIL · configured wash exposure
O₃ Supply MarginPASSAvailable 10.00 mg/minRequired 0.46 mg/minShortfall 0.00 mg/min
Overall StatusFAILResidual is below the selected food/process target.
Estimated EOG LifeNot specifiedConfirm on the selected product documentation.
4) Water Management — water use / operation saving
Water Management does not resize the ozone generator directly. It updates water usage, tank exchange/day, downtime saving, diagram labels, and the operation timeline.
Quick Simulation Inputs
1) Process Selection
2) Selected Ozone Equipment
3) Design Inputs — O₃ / CT Engineering
5) AI Equipment Recommendation
AI recommends equipment first. User-selected equipment remains editable and all engineering results recalculate live.
Live AI Engineering EvaluationFAILResidual is below the selected food/process target. Increase ozone capacity or warm-up/runtime, or reduce tank volume and organic load.
6) Operation Pattern / Timeline
RESIDUAL VS TIME / CT VS TIME
FAILWarm-up: 5.00 minWash: 1.00 minEnd-wash evaluation: 0.261 mg/L · CT 0.24 mg·min/L
Residual vs Time
CT vs Time