
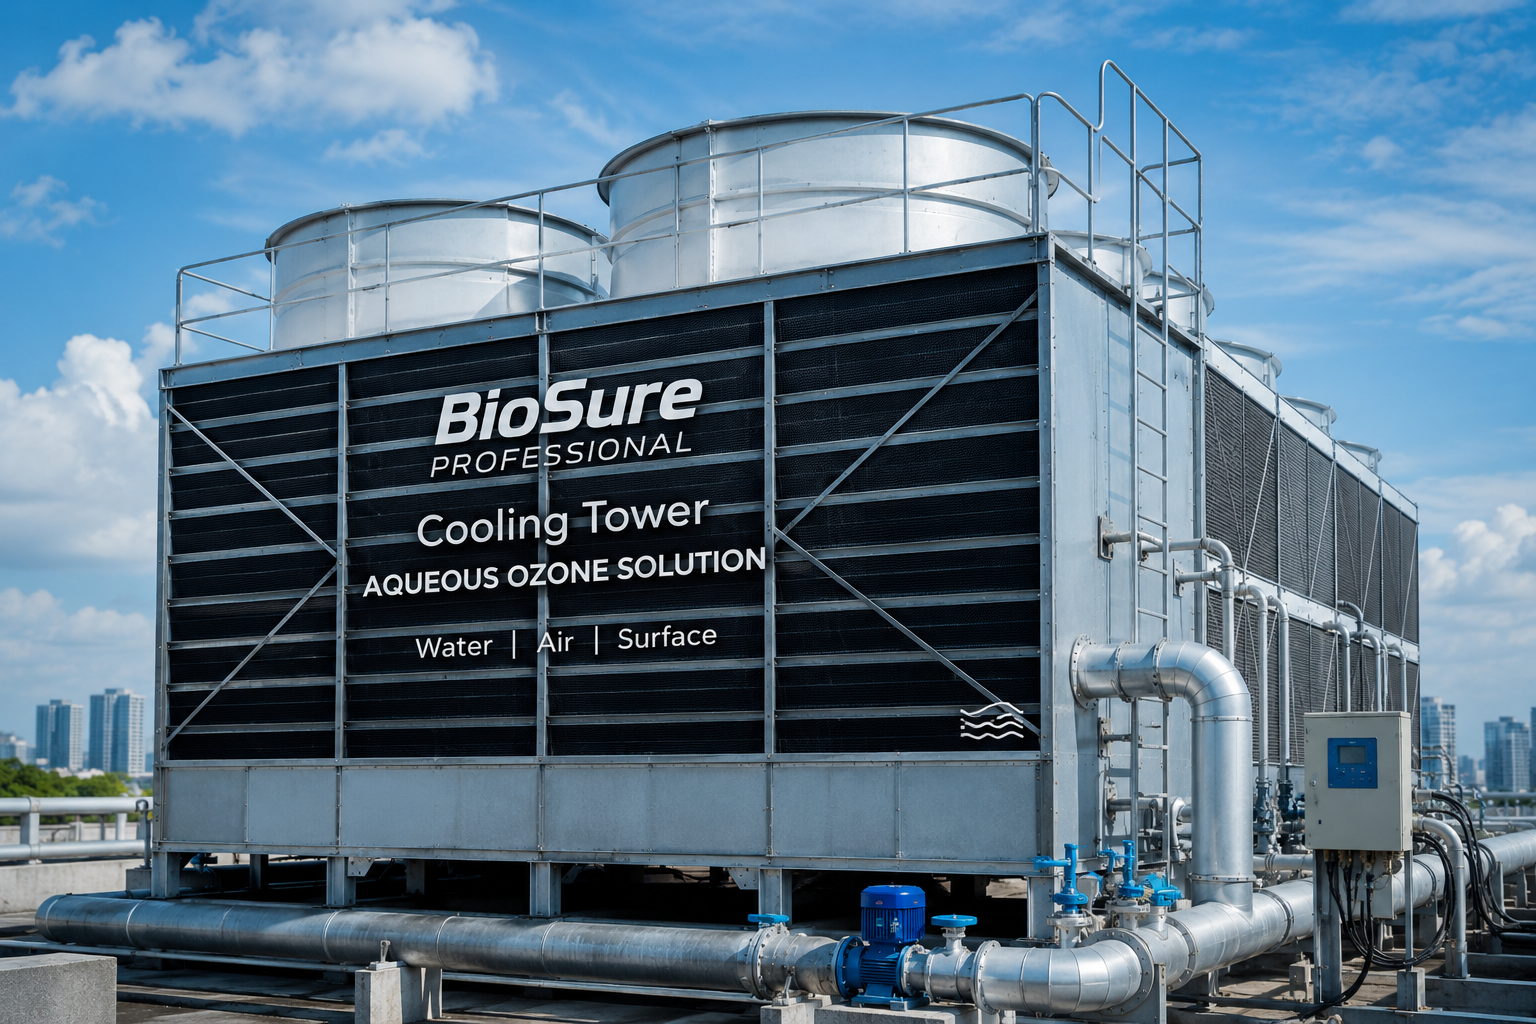
COOLING TOWER SOLUTION
OZONE SIDESTREAM TREATMENT
Ozone sidestream solution for biofilm reduction, basin water treatment, residual ozone monitoring and cooling tower maintenance optimization.
BES ENGINEERING SUPPORT
Turn the selected application into an engineered solution.
Share the site conditions, capacity and operating pattern with BES to confirm system design and product selection.
COOLING TOWER ECOSYSTEM
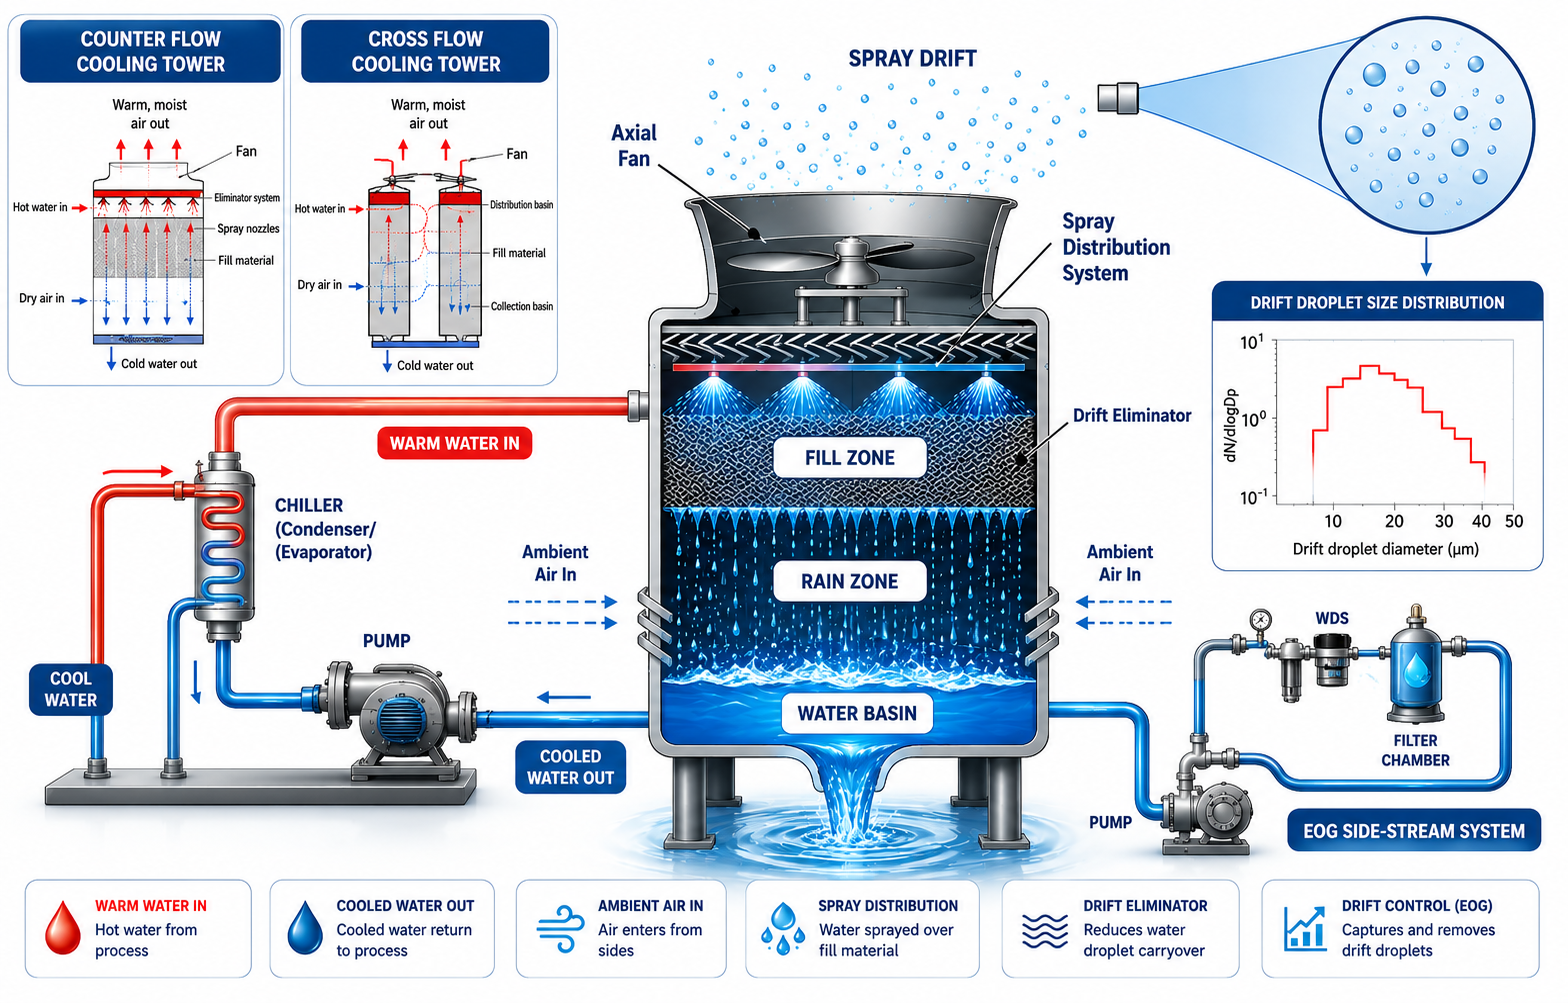
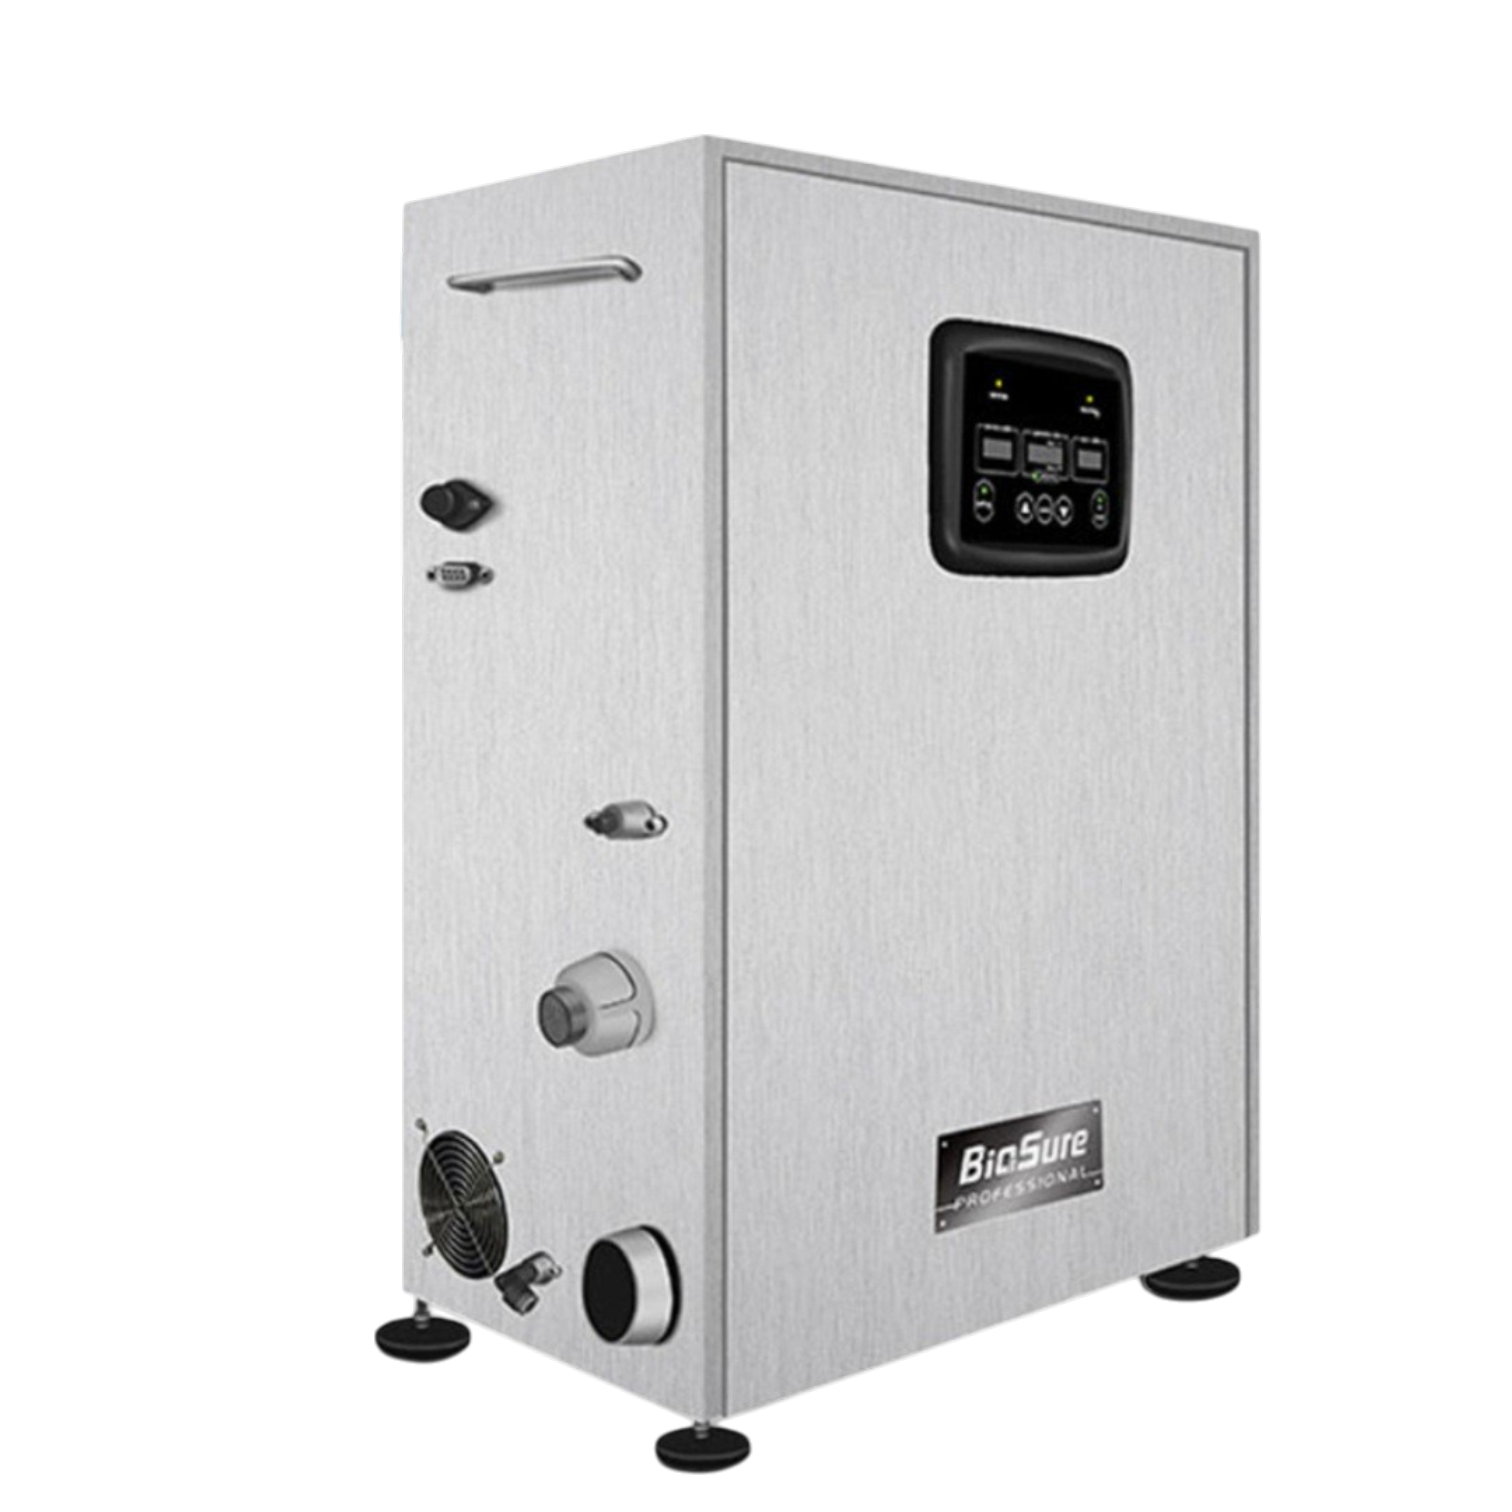
Cooling Tower Ozone Sidestream System
Independent ozone sidestream module connected with cooling tower basin, circulation pump, filtration, residual ozone monitoring, and maintenance workflow.
BES Cooling Tower Ozone Sidestream Simulation Report
Quick Simulation Inputs
Runtime Schedule
Cycle time1.50 hr
Approx. cycles/day10.7
Ozone ON10.7 hr/day
OFF / no ozone5.3 hr/day
Cycle calculation uses your manual Run / Rest values. Daily Operation is the total operating window; Ozone ON time is calculated from Run ÷ (Run + Rest). Without drain, residual decays naturally during OFF periods.
BES Recommended Design
PERFORMANCE SUMMARY
LOW DAILY CT
Main KPI 5 / 5: C Sub PASS • RT PASS • Turnover PASS • Residual PASS • Daily CT FAIL
Increase ozone model size, active hours or improve basin residual
C Sub (mg/L)
0.500STD ≥ 0.50 • PASS | PDissolved ÷ QSubContact RT (min)
1.000STD ≥ 1.00 • PASS | VContact ÷ QSub × 60Basin Turnover (x/day)
2.000STD ≥ 2.00 • PASS | QSide × ActiveHr ÷ VBasinBasin Residual Ref. (mg/L)
0.0143STD 0.01–0.05 • PASS | Operating rangeDaily CT Exposure (mg·min/L)
4.899STD ≥ 10 • FAIL | ON-cycle area × cycles/dayCT Circulation Ref. / Pass
0.143Reference only | Basin Residual × RT circulationLIVE ENGINEERING CALCULATION
1) C Sub
PDissolved ÷ QSub
600 ÷ 1200 = 0.500 mg/L
PASS / STD ≥ 0.50 mg/L
2) Contact RT
VContact ÷ QSub × 60
20 ÷ 1200 × 60 = 1.00 min
PASS / STD ≥ 1.00 min
3) Basin Turnover
QSide × ActiveHr ÷ VBasin
5000 × 16.0 ÷ 40000 = 2.00 x/day
PASS / STD ≥ 2.00 x/day
4) Basin Residual Ref.
k = auto decay + makeup loss
kTotal = 0.442 + makeup 0.000 = 0.442 (1/h)
Auto decay reference: temp 0.442 × pH 1.00 × TDS 1.00 = 0.442
Committed decay factor = 0.442
Csteady = 600 ÷ (34000 × 0.442) = 0.0399 mg/L
End ON = 0.0143 mg/L
PASS / STD 0.01–0.05 mg/L
5) Daily CT Exposure
Basin Residual × Active minutes
0.46 × 10.7 = 4.90 mg·min/L
FAIL / STD ≥ 10 mg·min/L
6) CT Circulation / Pass
Basin Residual × RT circulation
0.0143 × 10.00 = 0.14 mg·min/L/pass
PASS / BES Target ≥ 0.10 / GOOD ≥ 0.30
ENGINEERING REFERENCE
P Dissolved600mg/hFormula: Ozone Output × Units × MTE1,000 mg/h × 1 unit(s) × 60% = 600 mg/h dissolved ozone.
C Side0.120mg/LFormula: CSub × QSub ÷ QSide0.500 × 1200 ÷ 5000 = 0.120 mg/L. Distribution reference only.
C Basin After Rest0.0114mg/LFormula: C Basin End × e^(-k × t_off)After OFF/rest 30 min. CT is not decayed; only residual concentration decays.
Contact Tank Volume20LFormula: Actual contact tank water volumeUse actual contact tank water volume after OWS. RT = Contact Tank Volume ÷ QSub × 60.
Daily CT Exposure4.90mg·min/LFormula: Basin Residual × active minutesON-cycle CT 0.46 × 10.7 cycles/day = 4.90 mg·min/L.
Ozone Consumption10.7g/dayFormula: Ozone Output × Units × active hours1,000 mg/h × 1 unit(s) × 10.7 hr/day = 10.7 g/day.
EOG Lifetime (Estimated)
ModelOWS-1
Operating hours to replacement3 years
Ozone ON time per day10.7 hr/day
Estimated replacement3 years
≈ 36 months
≈ 36 months
Reference: OWS = 3 years. WDS3000P = 4,000 hr. Other WDS models = 1,000 hr. Actual lifetime depends on water quality, operation and maintenance.
24-Hour Ozone Performance Trend — 1 hr ON / 0.5 hr OFF
C Sub Trend
C Side Trend
C Basin Trend
CT Circulation / Pass Trend
ⓘ Note: Simulation results are estimates for reference only. Actual performance may vary depending on site conditions.